
Genetic interactions (GIs) consist of synthetic lethality (SL) and synthetic viability (SV). CellGIdb aims to provide cell type-specific SL and SV networks. CellGIdb contains 1,086,649 cells from 42 single-cell datasets of 14 tumors, 93,473 SL, 14,038 SV, 2,693 drugs and 694 samples from immunotherapy cohorts. Moreover, CellGIdb provides six flexible interactive tools for retrieval, visualization, and analysis of SL and SV networks.
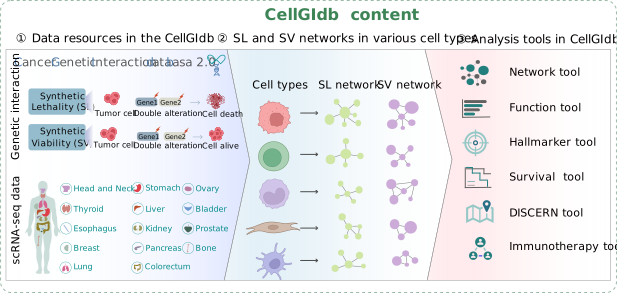
Cell-type-specific genetic interaction analysis tool presentation

GI-Network
The GI-Network tool displays the edge and node weights in the SL and SV networks across various cell types.
Enter
GI-Function
The GI-Function tool identifies the functions of genes with high weights in the SL and SV networks using Gene Ontology and KEGG biological pathways.
Enter
GI-Hallmarker
The GI-Hallmarker tool performs Spearman correlation analysis of SL, SV network scores, and hallmarker pathways scores in malignant epithelial cells.
Enter
GI-Survival
The GI-Survival tool performs univariate Cox regression analysis, log-rank test, and KM survival curves for SL and SV gene pair set across various cancer types.
Enter
GI-Drug
The GI-Drug tool leverages pharmacogenomic screens to identify SL and SV associated with drug effects and compute the drug sensitivity score of single-cell transcriptomic data.
Enter
GI-Immunotherapy
The GI-Immunotherapy tool shows the difference in T cell–associated SL and SV gene pair scores between responding and non-responding immunotherapy patients.
EnterData statistics

42 Datasets

1,086,649 Cells

14 Tumors

107,511 GIs

11 Cell Types
External link