
Overview of CellGIdb
Genetic interactions include synthetic lethality (SL) and synthetic viability (SV) interactions. CellGIdb is a database that aims to provide SL and SV interaction networks in a specific cell type across 14 human tumor types, spanning 1,086,649 single cells. Moreover, CellGIdb provides six major analytical tools for SL and SV interaction network.
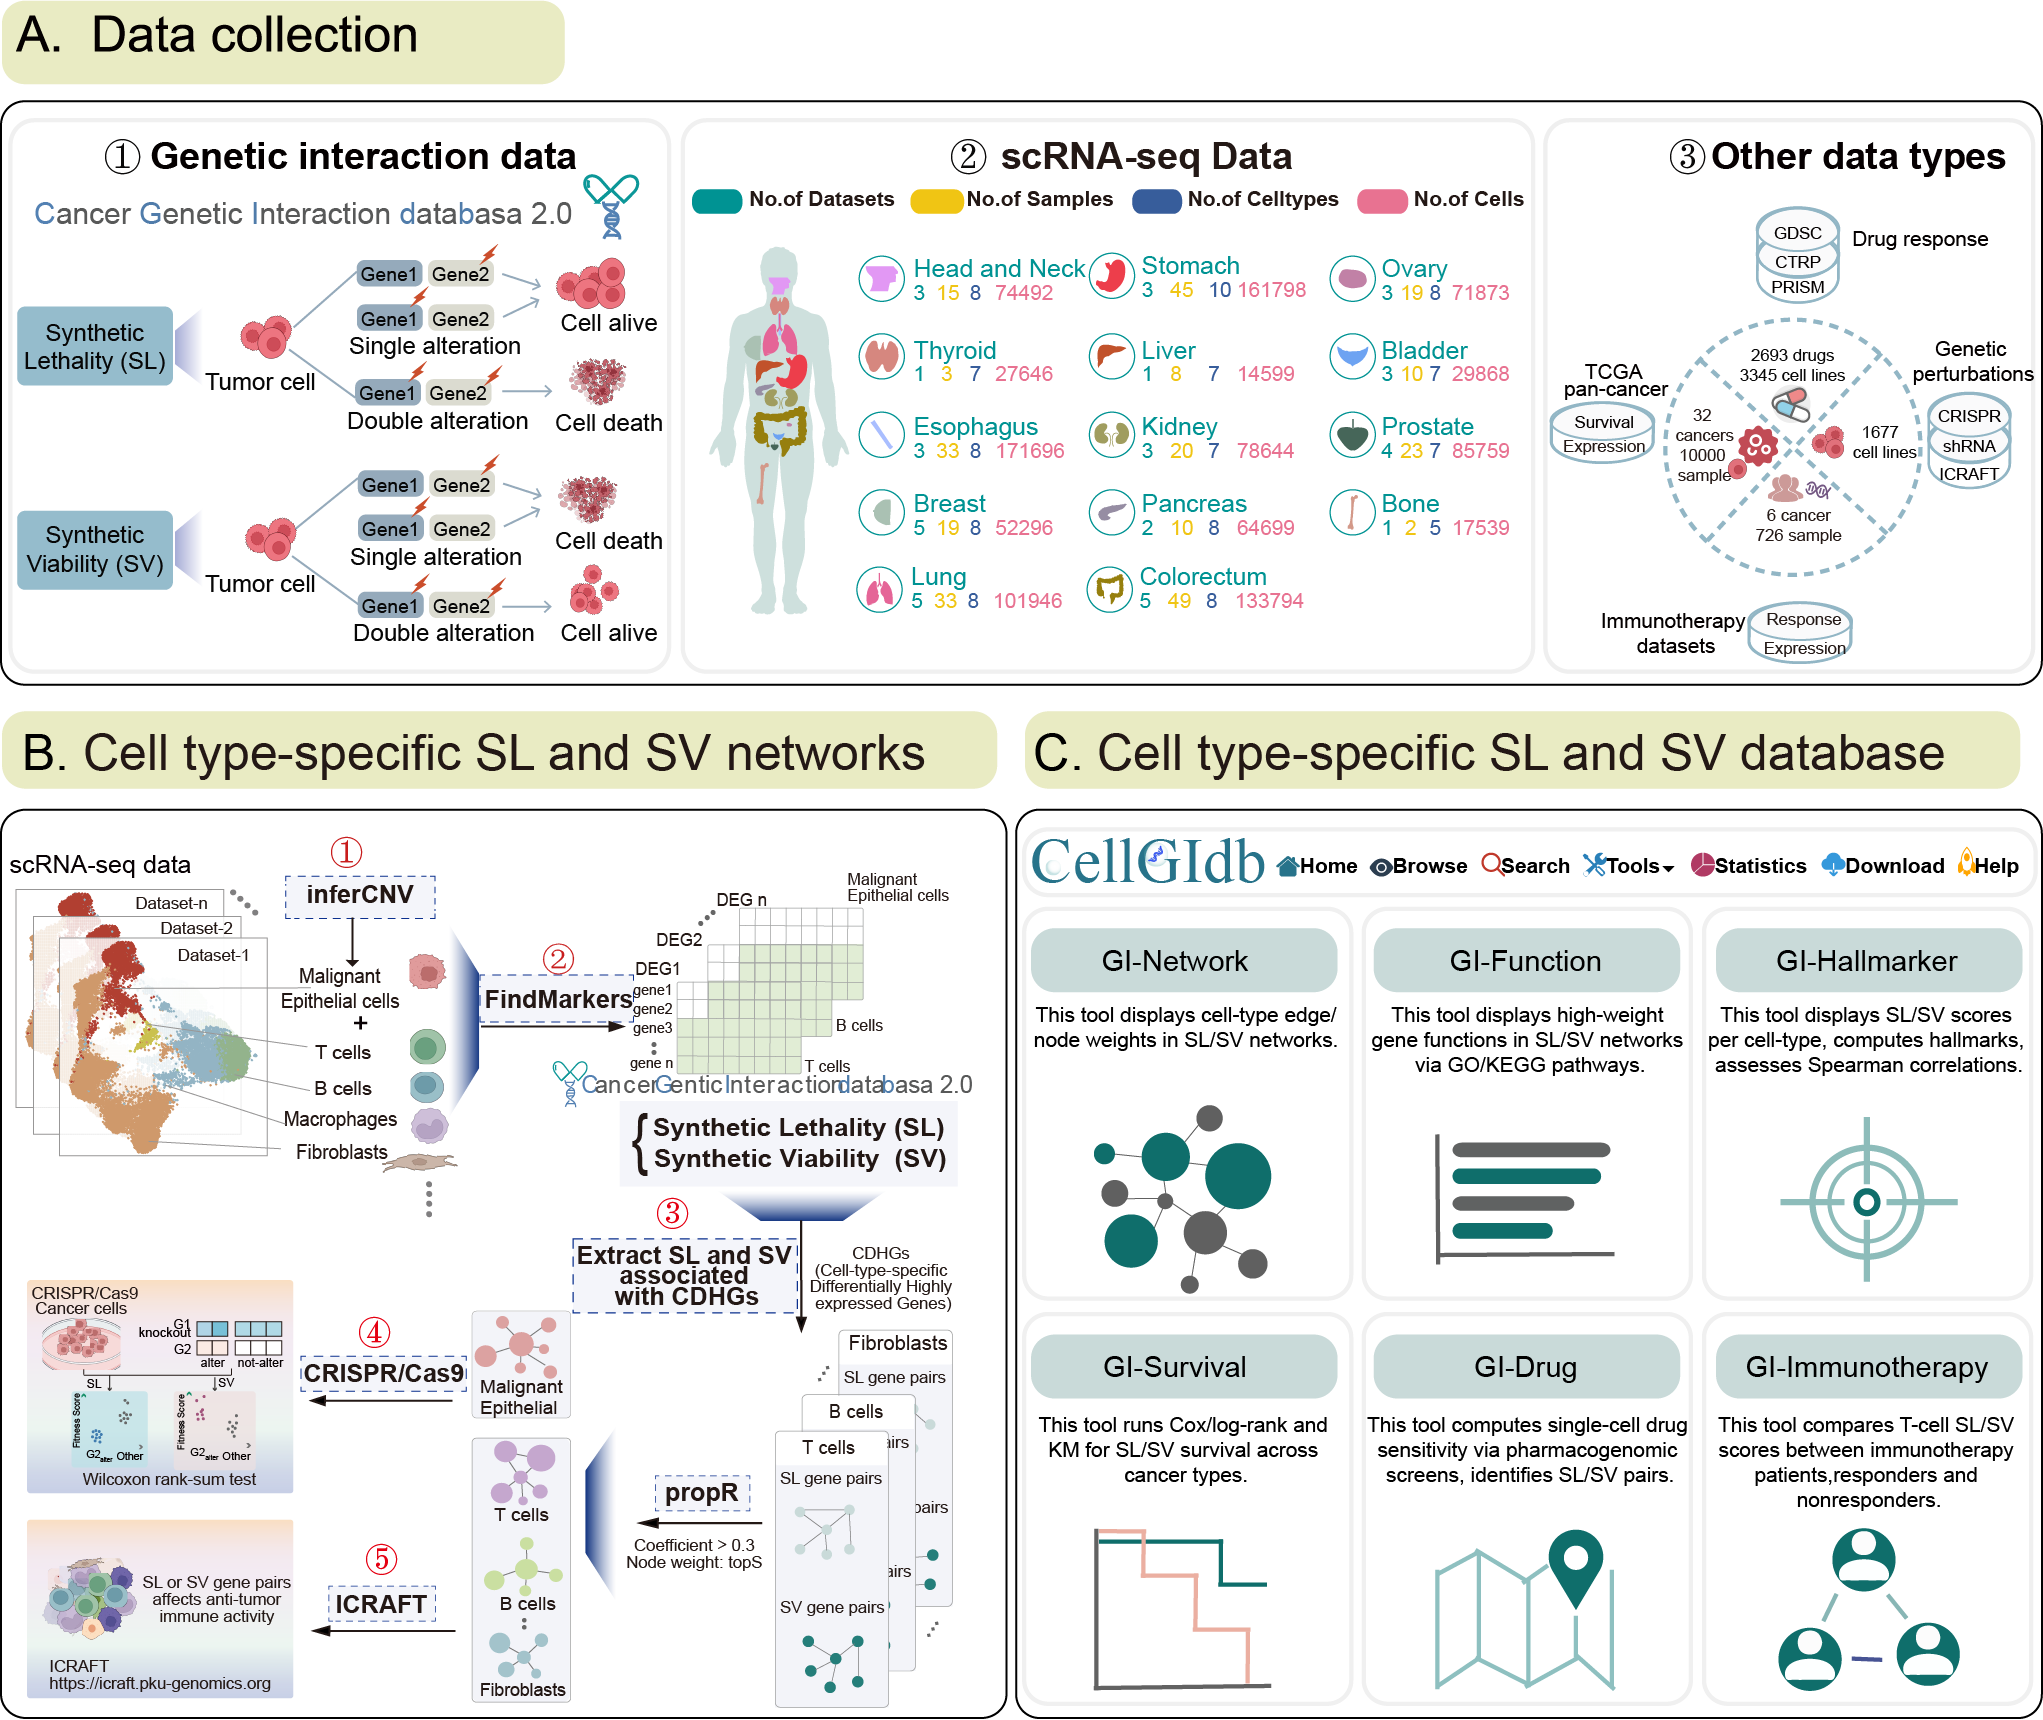
Overview of data content and functions of CellGIdb. The top panels demonstrate the dataset content. The bottom panels demonstrate the functional frameworks to retrieve, analysis and visualize data.
Data Collection
The data collection of the CellGIdb consists of two main parts: cancer scRNA-seq profiles and genetic interactions gene pairs from CGIdb 2.0 (Figure 1-1).
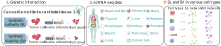
Figure 1-1. Data collection of the CellGIdb database
1.The scRNA-seq datasets were collected from GEO and ArrayExpress databases. The dataset included a total of 1,086,649 cells from 42 single-cell RNA sequencing (scRNA-seq) datasets for a total of 14 cancer types.
2.The genetic interactions gene pairs were downloaded from CGIdb 2.0 database ( http://www.medsysbio.org/CGIdb2/), including 73,098 SL and 16,106 SV gene pairs.
Identification of cell-type-specific SL and SV interactions
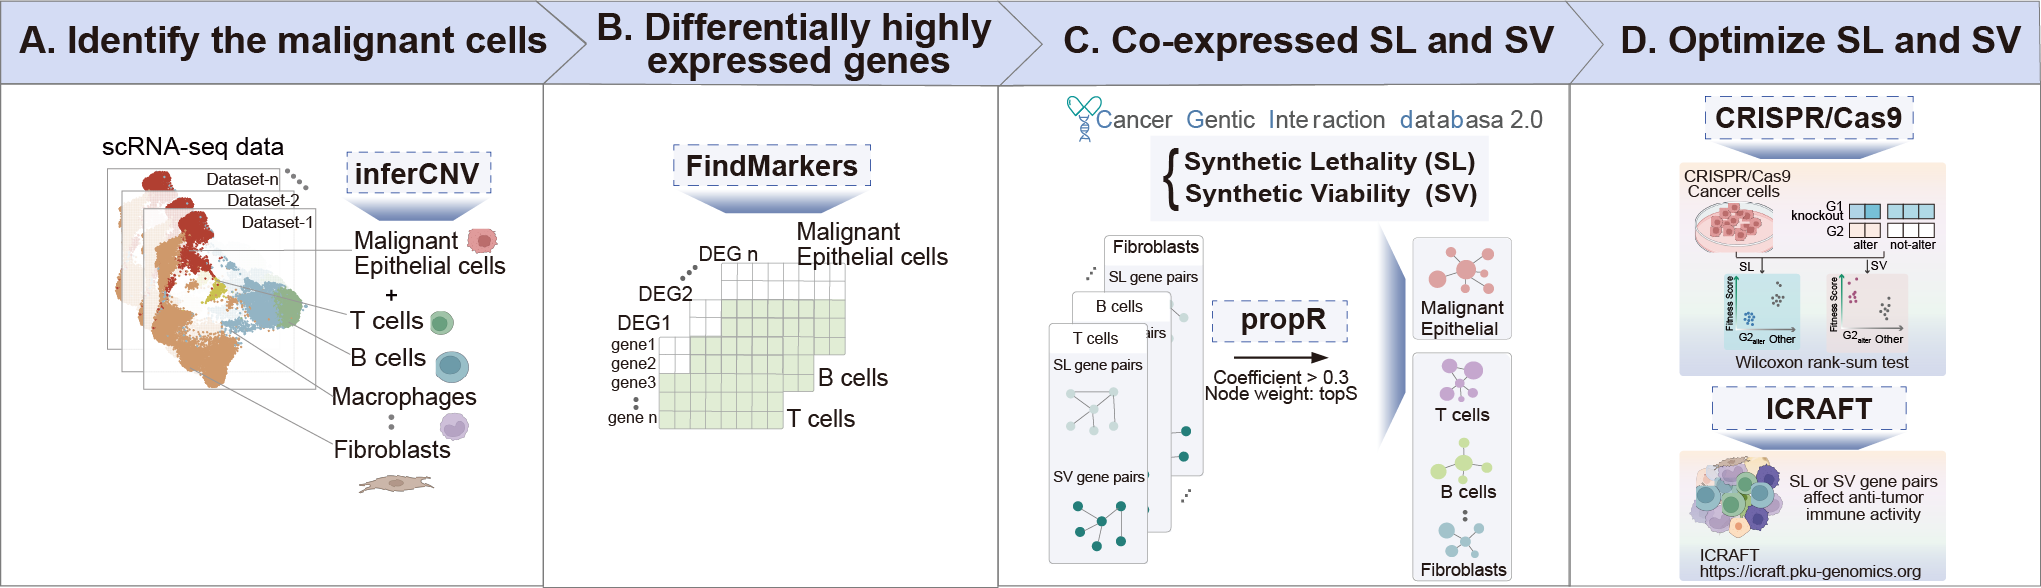
Figure 1-2. Identification of cell-type-specific genetic interactions
1. Copy Number Variation (CNV) Inference for Malignant Epithelial Cells.
For a given cancer-type dataset, we apply inferCNV to estimate single-cell copy number variations (CNVs), using T cells as the reference population to identify malignant epithelial cells (Figure 1-2A).
2. Cell-Type-Specific Marker Gene Identification.
For a specific cell type in a dataset, we first use the “FindMarkers” function to identify differentially highly expressed genes associated with that cell type (Figure 1-2B).
3. Co-Expressed Synthetic Lethality (SL) and Synthetic Viability (SV) Gene Pair Screening.
Based on SL/SV gene pairs from the CGIdb database, we apply the “propR” method to identify cell-type-specific co-expressed SL/SV pairs with: Correlation coefficient > 0.3; At least one gene in the pair is a cell-type-specific differentially highly expressed genes (Figure 1-2C).
4. CRISPR-Based Functional Validation in Malignant Epithelial Cells.
For SL/SV pairs of malignant epithelial cells, we further filtered gene pairs using CRISPR knockout screen. Specifically, for SL pairs, we required that in cell lines with alterations in gene G1, knockout of gene G2 resulted in significantly lower cell viability scores. For SV pairs, we required that in cell lines with alterations in gene G1, knockout of gene G2 resulted in significantly higher cell viability scores (Figure 1-2D).
For non-malignant epithelial cells in the tumor microenvironment, we required that one gene in the SL or SV pair affects anti-tumor immune activity. The gene set related to anti-tumor immune activity was obtained from the ICRAFT database ( https://icraft.pku-genomics.org) (Figure 1-2D).
CellGIdb’s Home
1.CellGIdb's navigation bar.
2.All of CellGIdb's powerful analysis tools.
3.Click the links to go to the corresponding functional interface.
4.CellGIdb's statistical data results.
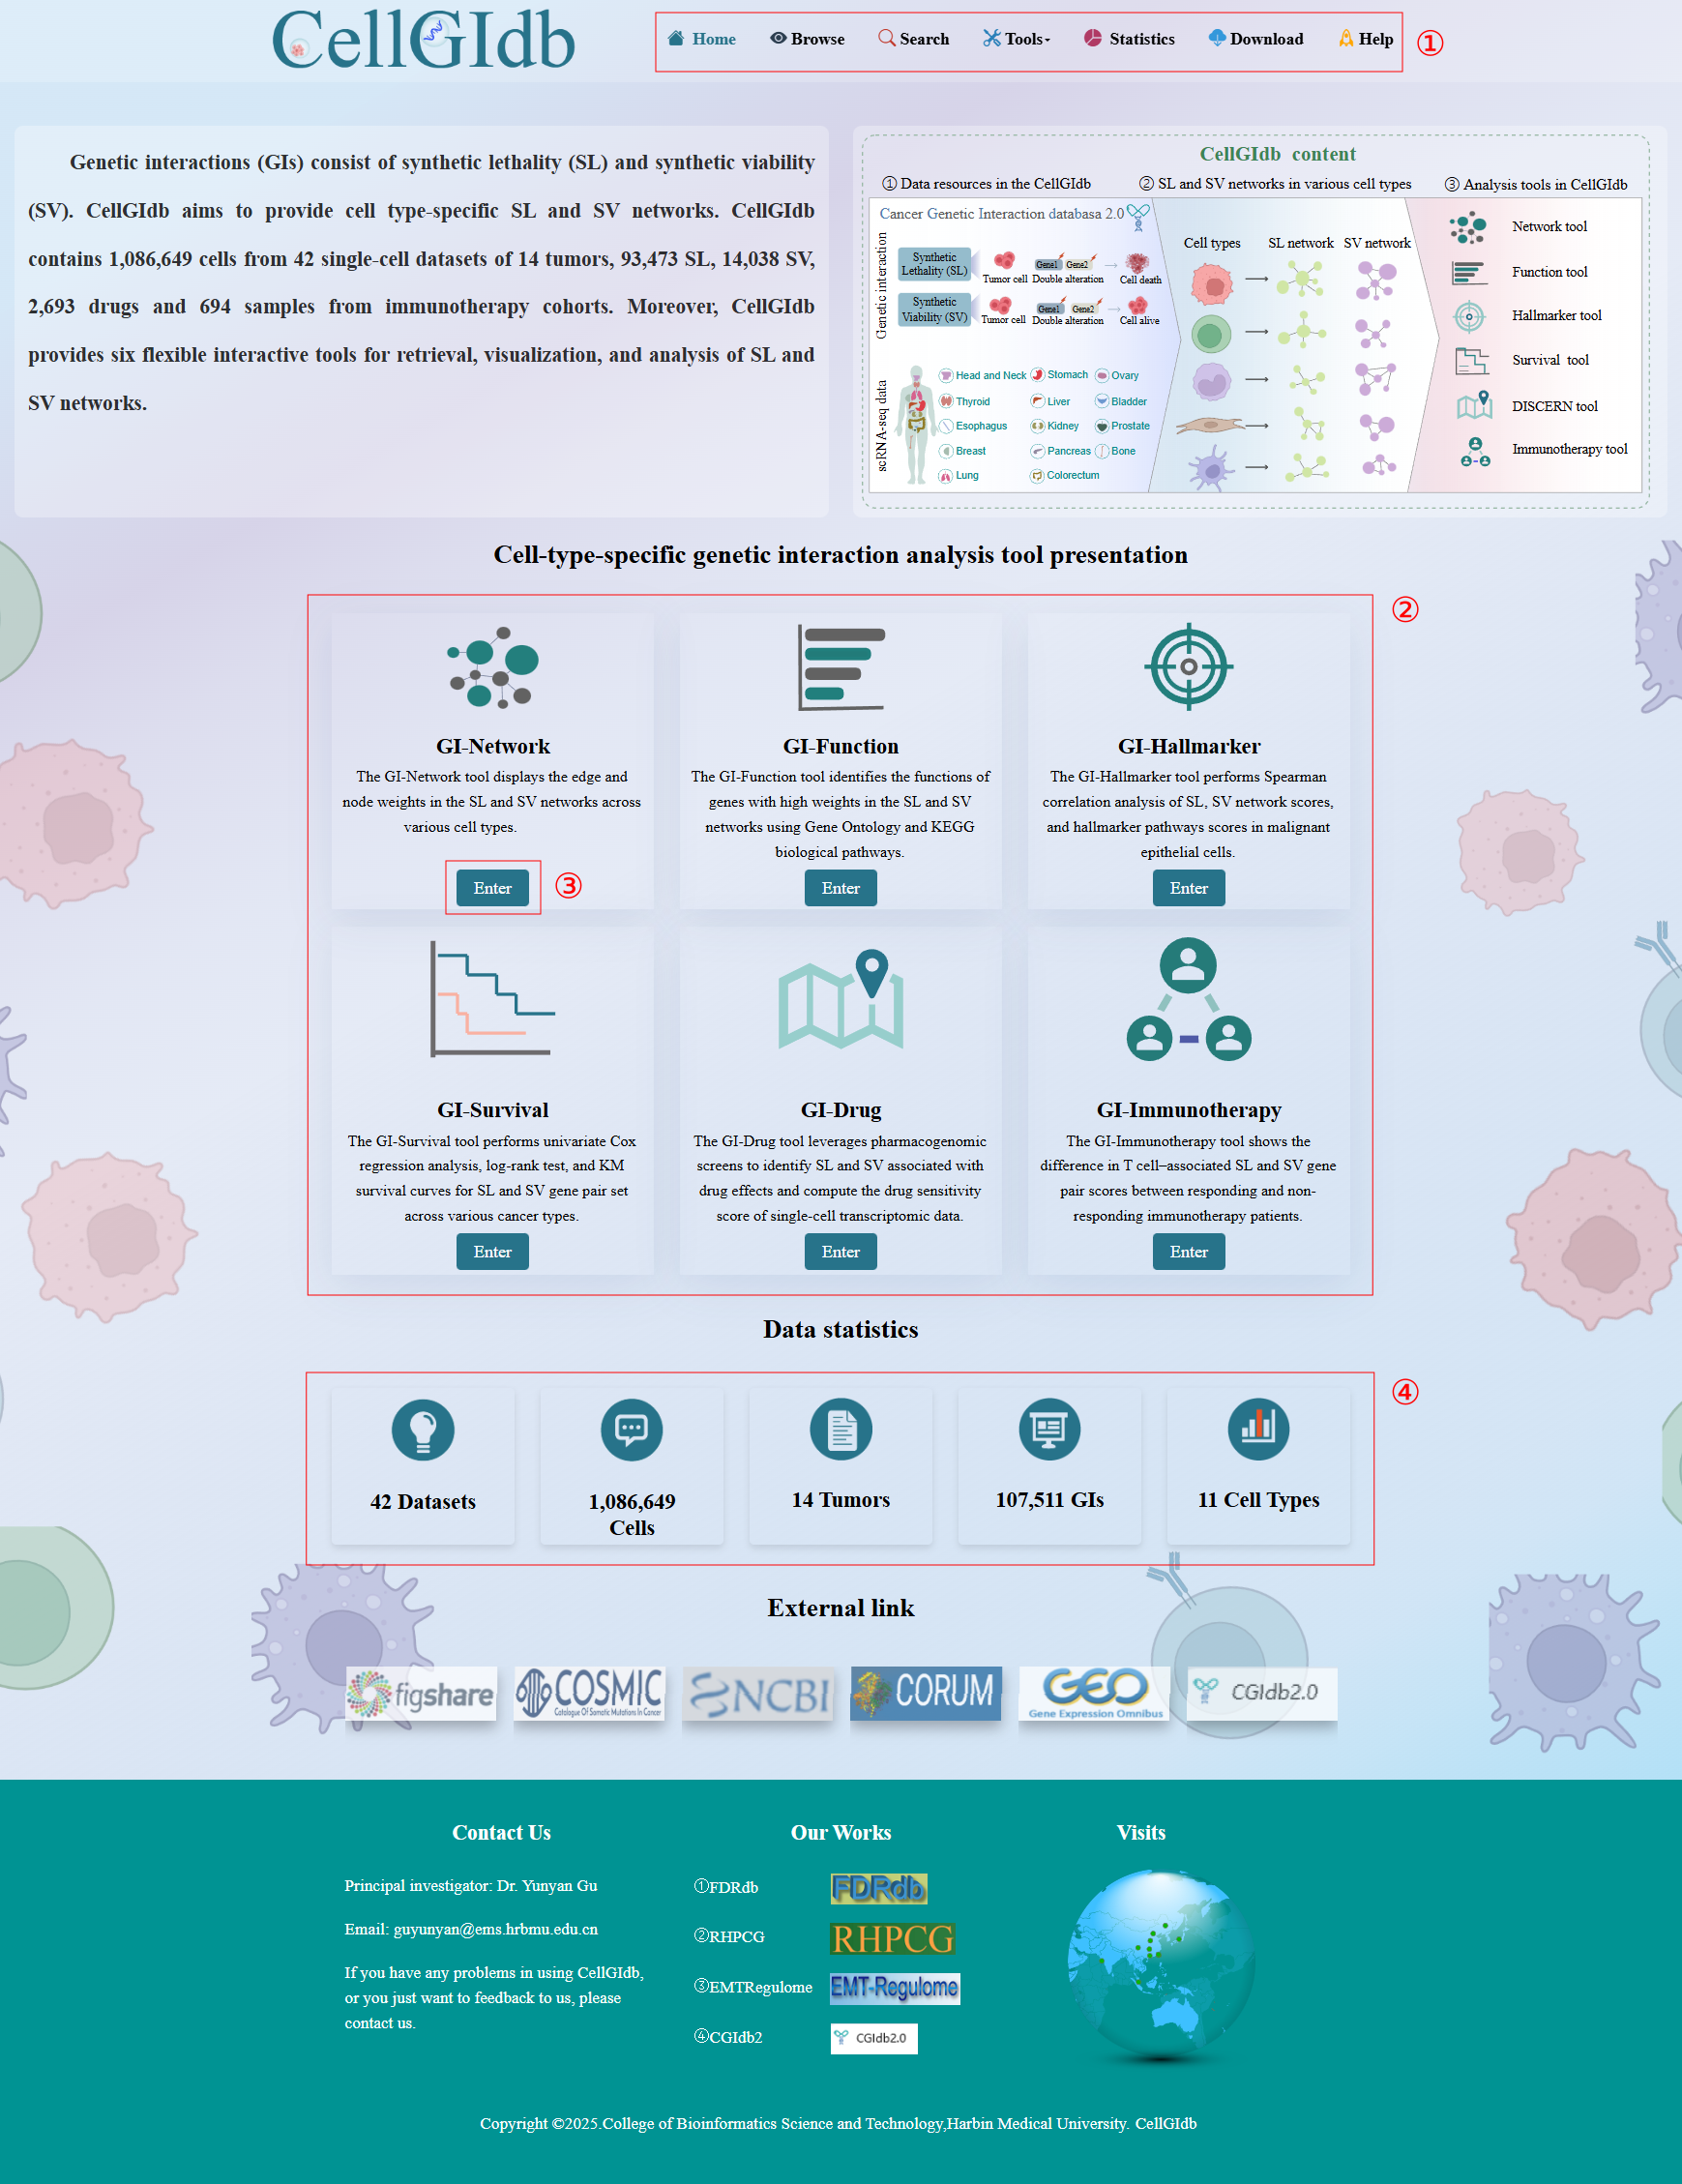
Figure 1-3.CellGIdb's home page
CellGIdb’s Browse
1.CellGIdb's dendritic structure. You can check out its results by clicking on the cell type below cancer type.
2.Tables of results. You can view all the SL and SV interaction information related to cancer type and cell type.
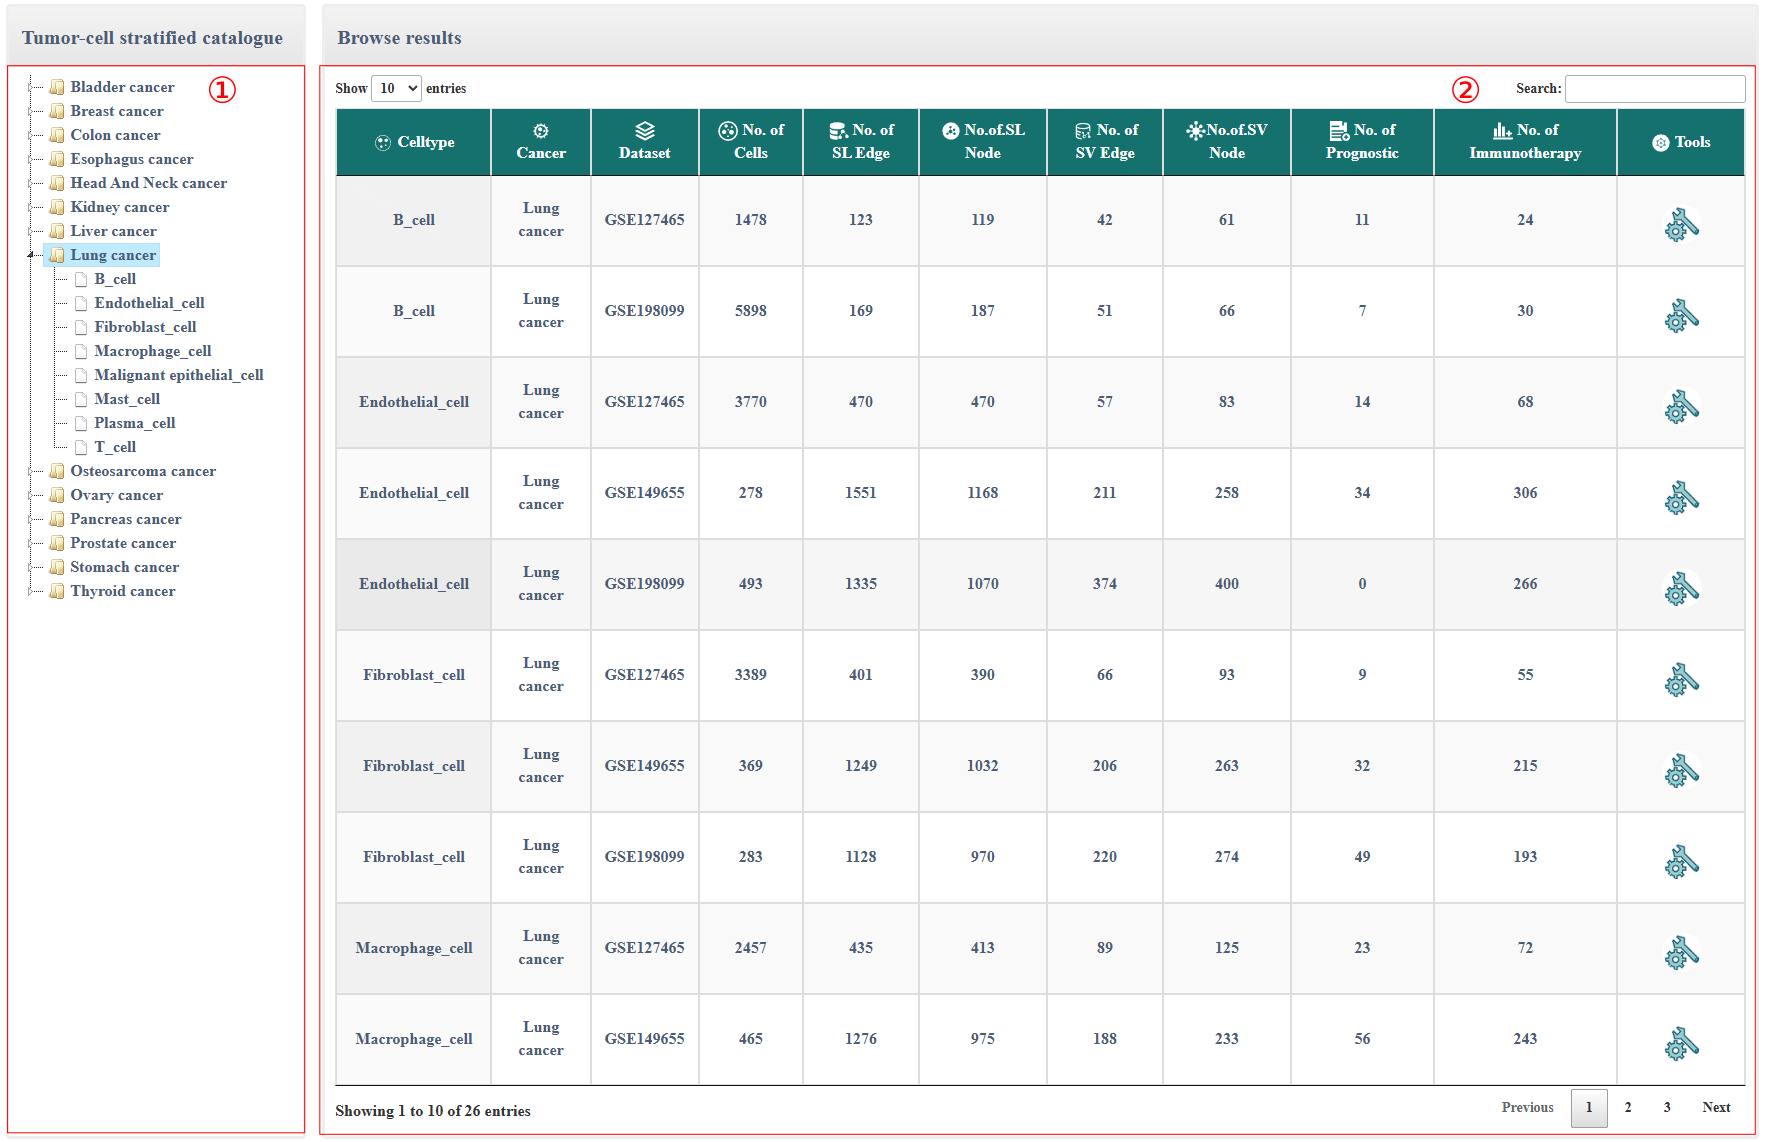
Figure 2
No. of cells: the number of cells in the corresponding cell type.
No. of SL Edge: the number of edges in SL interaction network.
No. of SL Node: the number of nodes in SL interaction network.
No. of SV Edge: the number of edges in SV interaction network.
No. of SV Node: the number of nodes in SV interaction network.
No. of Prognostic: the number of SL and SV gene pairs associated with prognostic of cancer patients from TCGA datasets.
No. of Immunotherapy: the number of SL and SV gene pairs associated with immunotherapy response of cancer patients from various datasets.
Tools: interfaces for further analysis.
CellGIdb’s Search
1.Select the cancer type and cell type for your search.
2.Search the cell type.
3.The search result for cell-type-specific SL and SV network.
No. of cells: the number of cells in the corresponding cell type.
No. of SL Edge: the number of edges in SL interaction network.
No. of SL Node: the number of nodes in SL interaction network.
No. of SV Edge: the number of edges in SV interaction network.
No. of SV Node: the number of nodes in SV interaction network.
No. of Prognostic: the number of SL and SV gene pairs associated with prognostic of cancer patients from TCGA datasets.
No. of Immunotherapy: the number of SL and SV gene pairs associated with immunotherapy response of cancer patients from various datasets.
4. The function panel navigates to 6 tools.
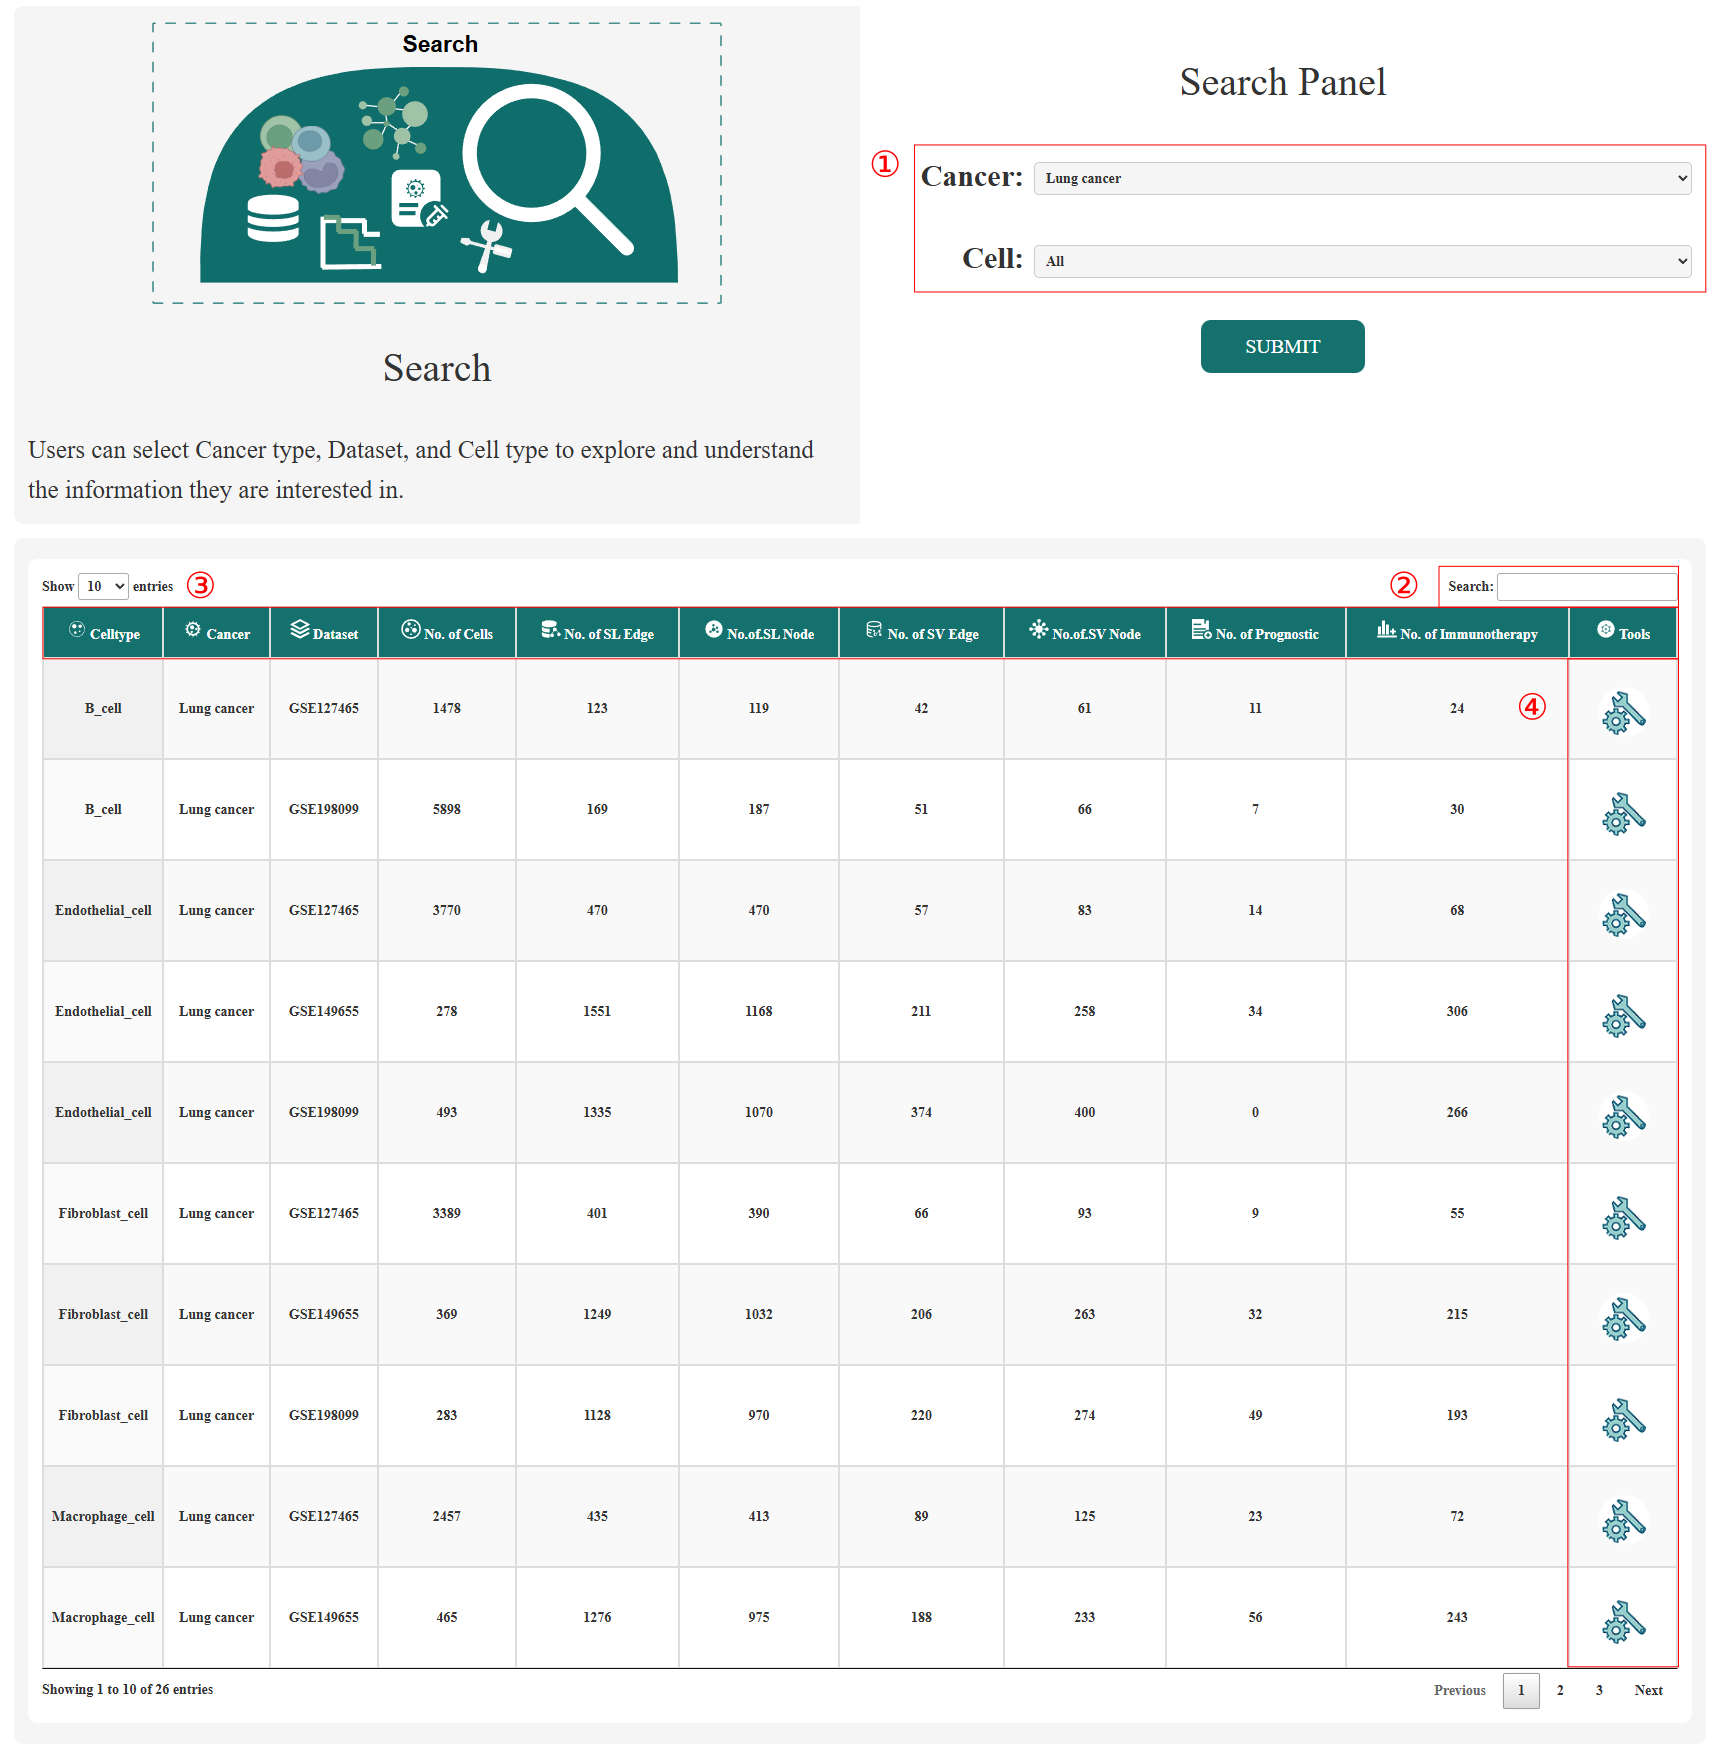
Figure 3
Tools:GI-Network
1.Select the cancer type, dataset and cell type for your search.
2.The SL network for specific cell types, where nodes represent genes involved in SL interactions and edges represent SL relationships between gene pairs. Node weights indicate gene centrality within the SL network, while edge weights represent the co-expression coefficients of gene pairs in the specific cell type.
3.The SV network for specific cell types, where nodes represent genes involved in SV interactions and edges represent SV relationships between gene pairs. Node weights indicate gene centrality within the SV network, while edge weights represent the co-expression coefficients of gene pairs in the specific cell type.
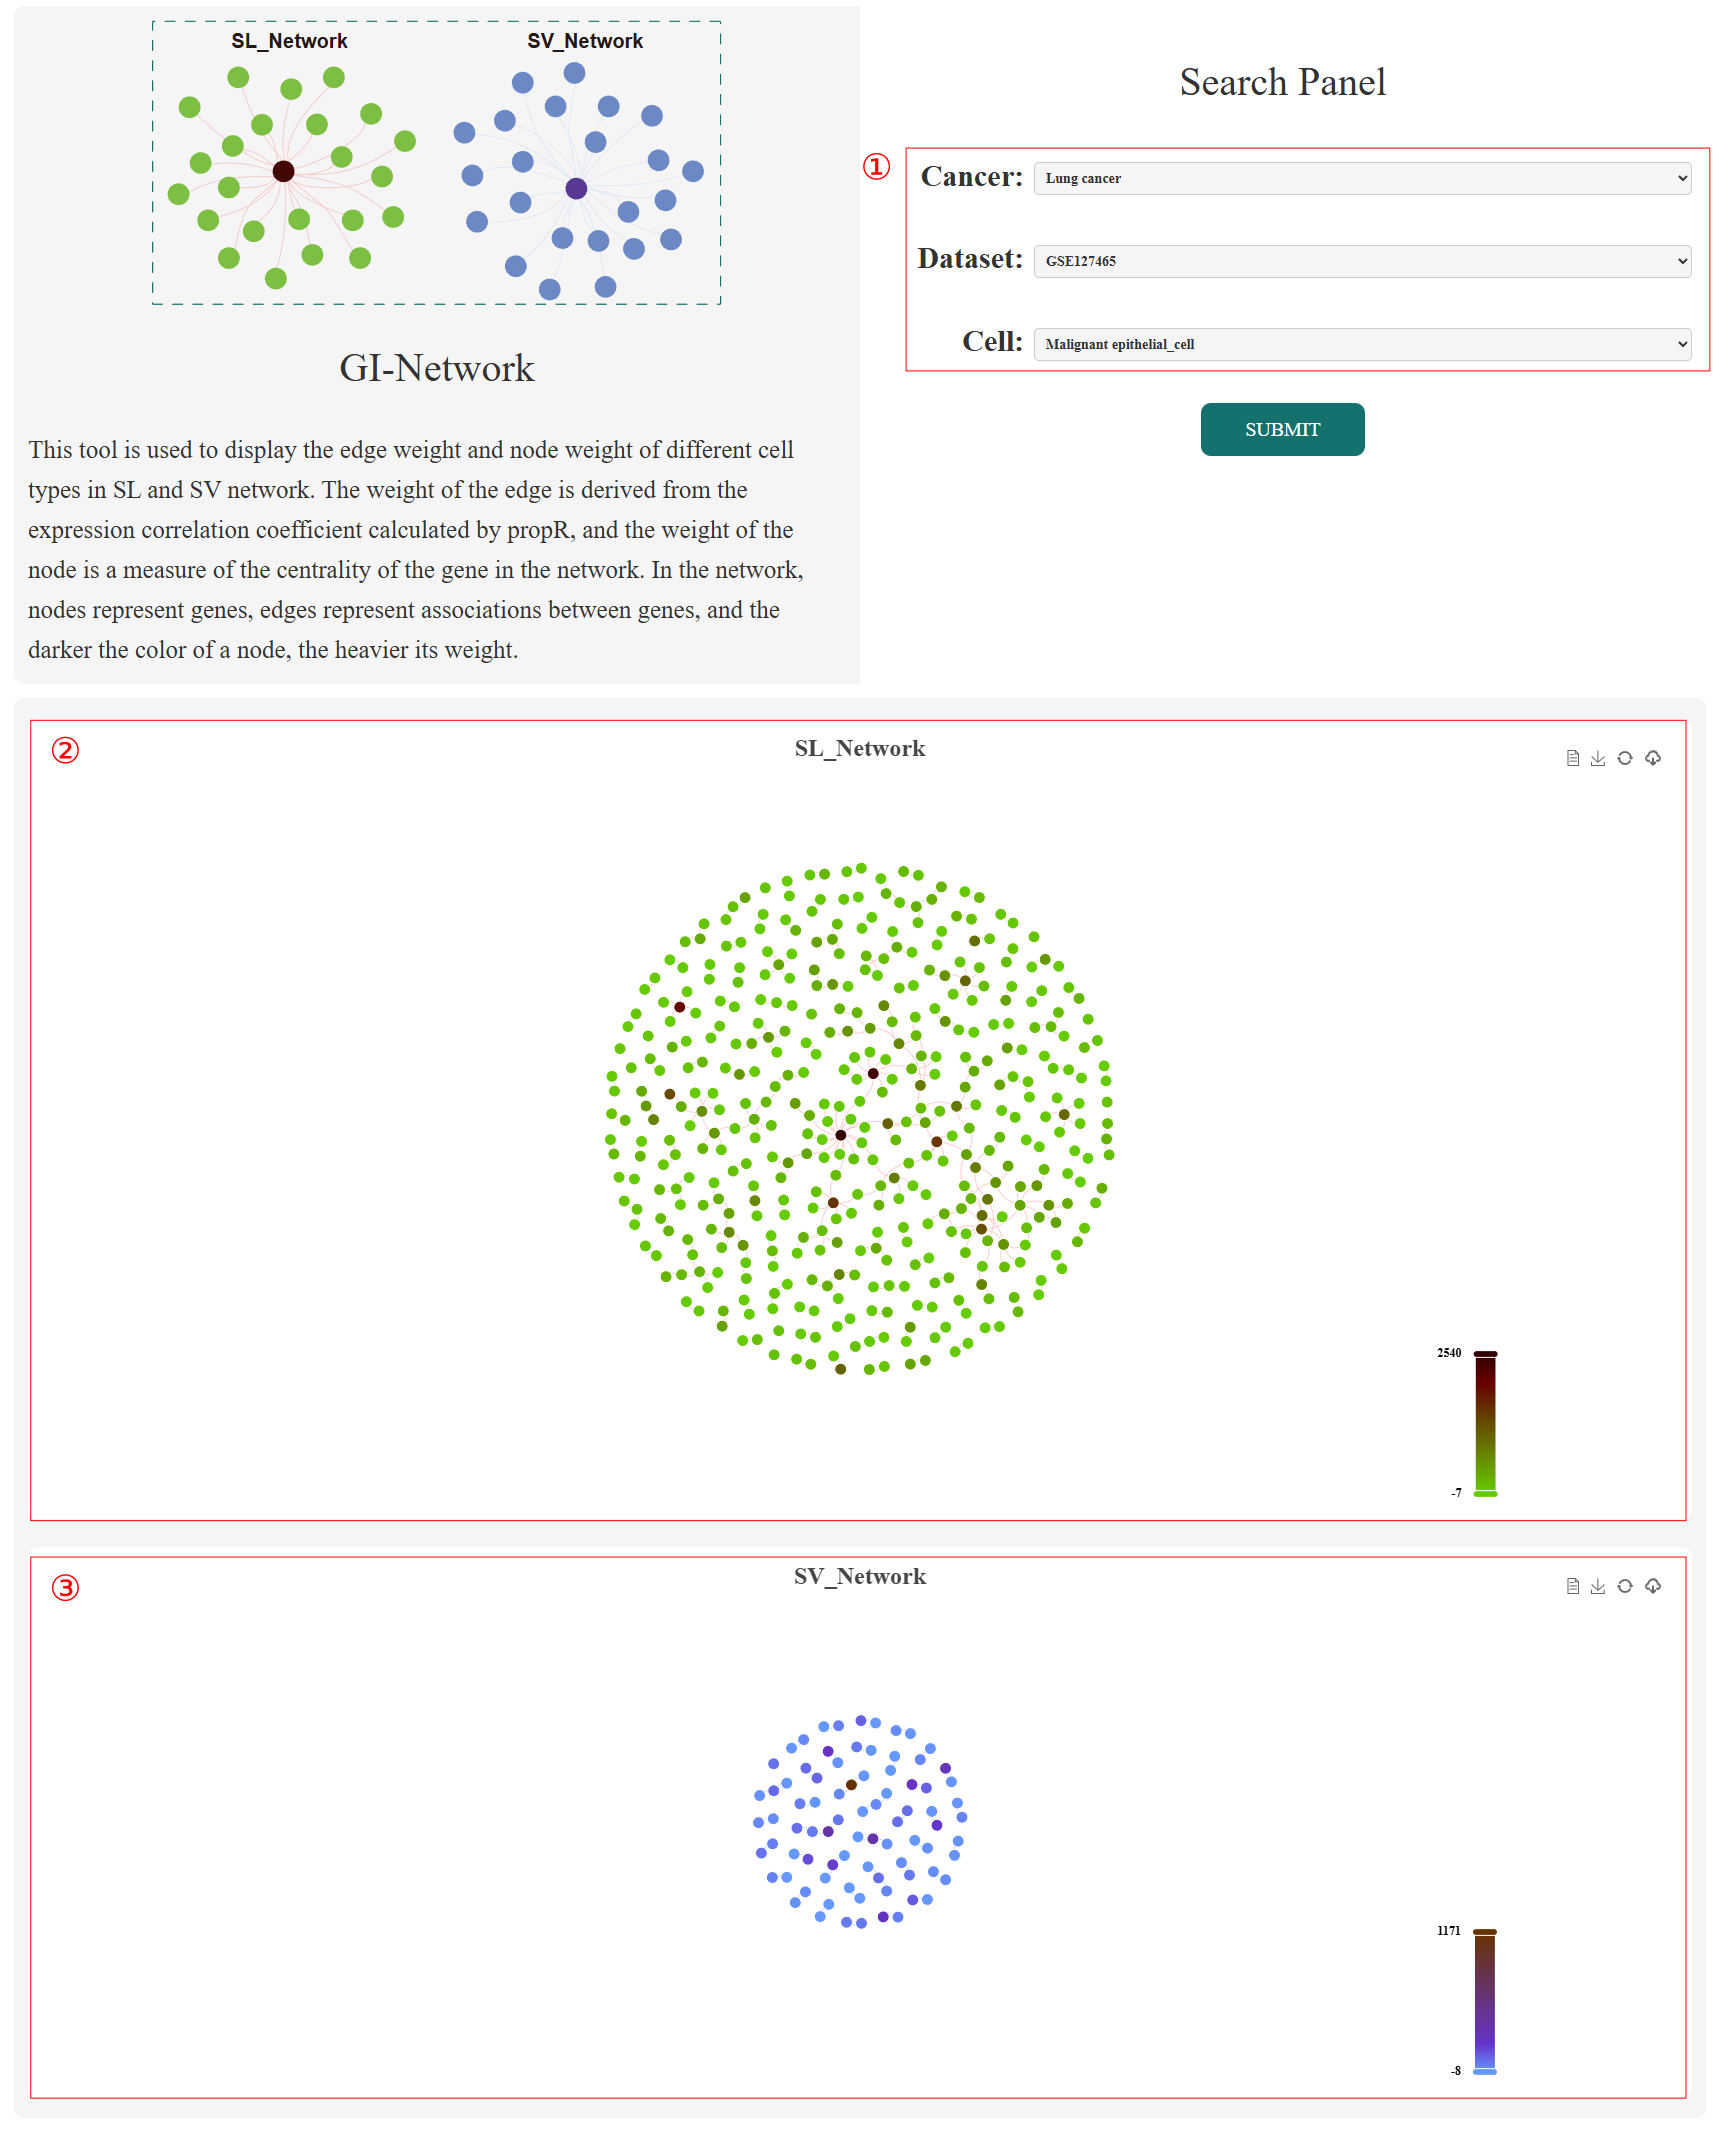
Figure 4
Tools:GI-Function
1.Select the cancer type, dataset and cell type for your search.
2.KEGG functional enrichment analysis of the top 100 genes by node weight in both the SL and SV networks.
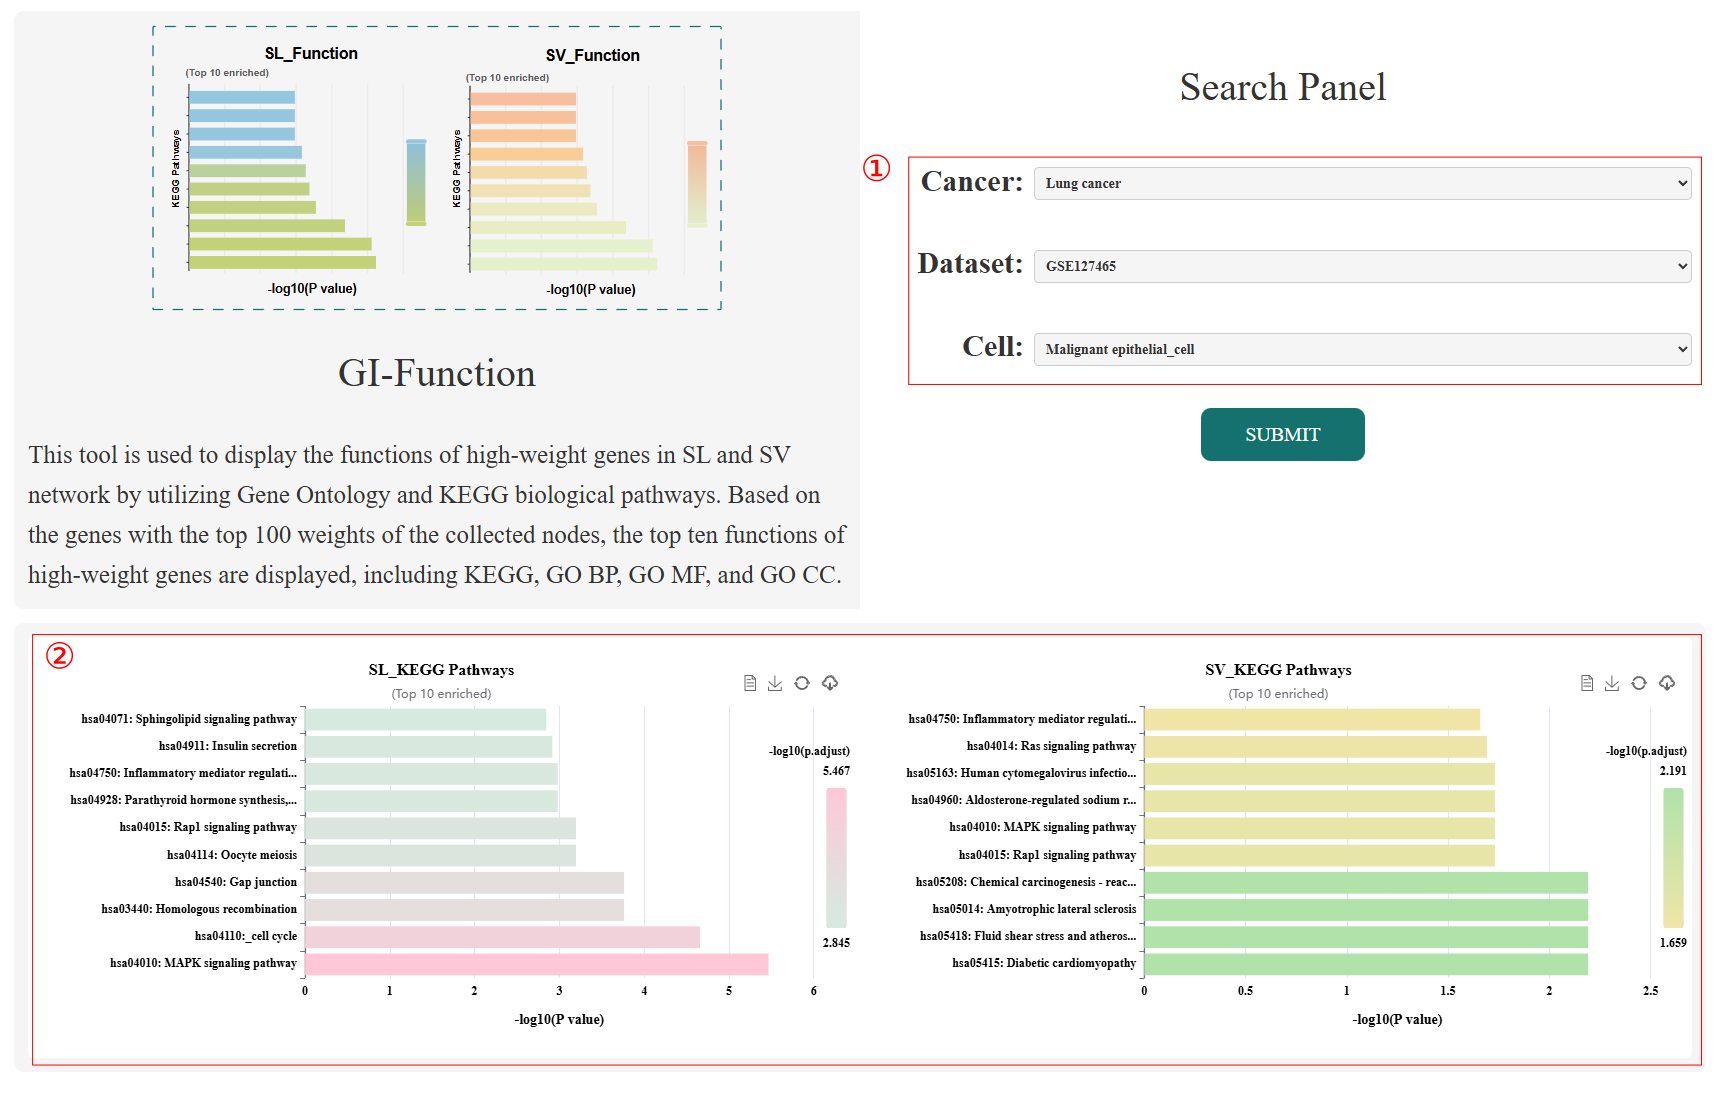
Figure 5
Tools:GI-Hallmarker
1.Select the cancer type, dataset and cell type for your search.
2.Correlation analysis between the scores of gene sets in SL (Synthetic Lethality) and SV (Synthetic Viability) networks with the scores of 50 cancer hallmark gene sets, where the 50 hallmark gene sets were obtained from MSigDB (https://www.gsea-msigdb.org/gsea/msigdb).
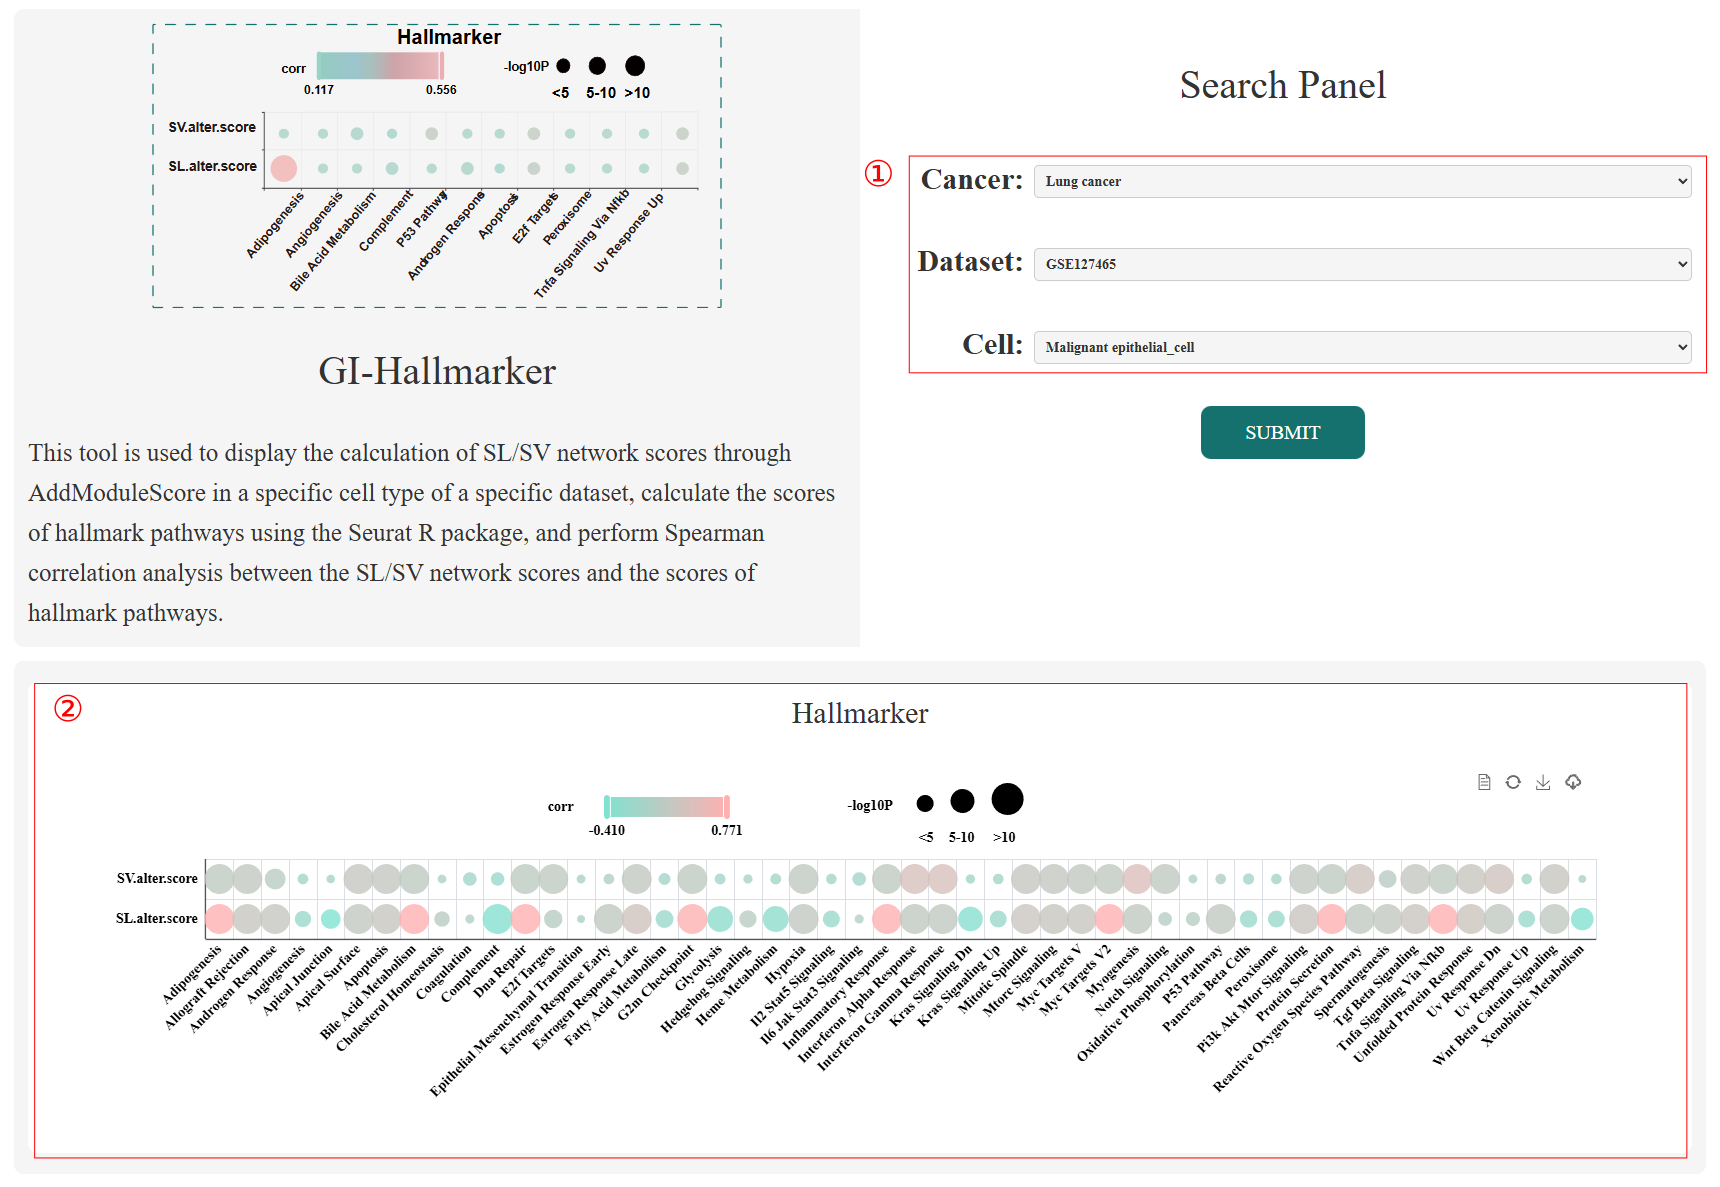
Figure 6
Tools:GI-Survival
1.Select the cancer type, dataset, cell type, dataset of survival, SL and SV gene pair for your search.
2.The Kaplan-Meier survival curves compare patients with altered versus unaltered SL and SV gene pairs.
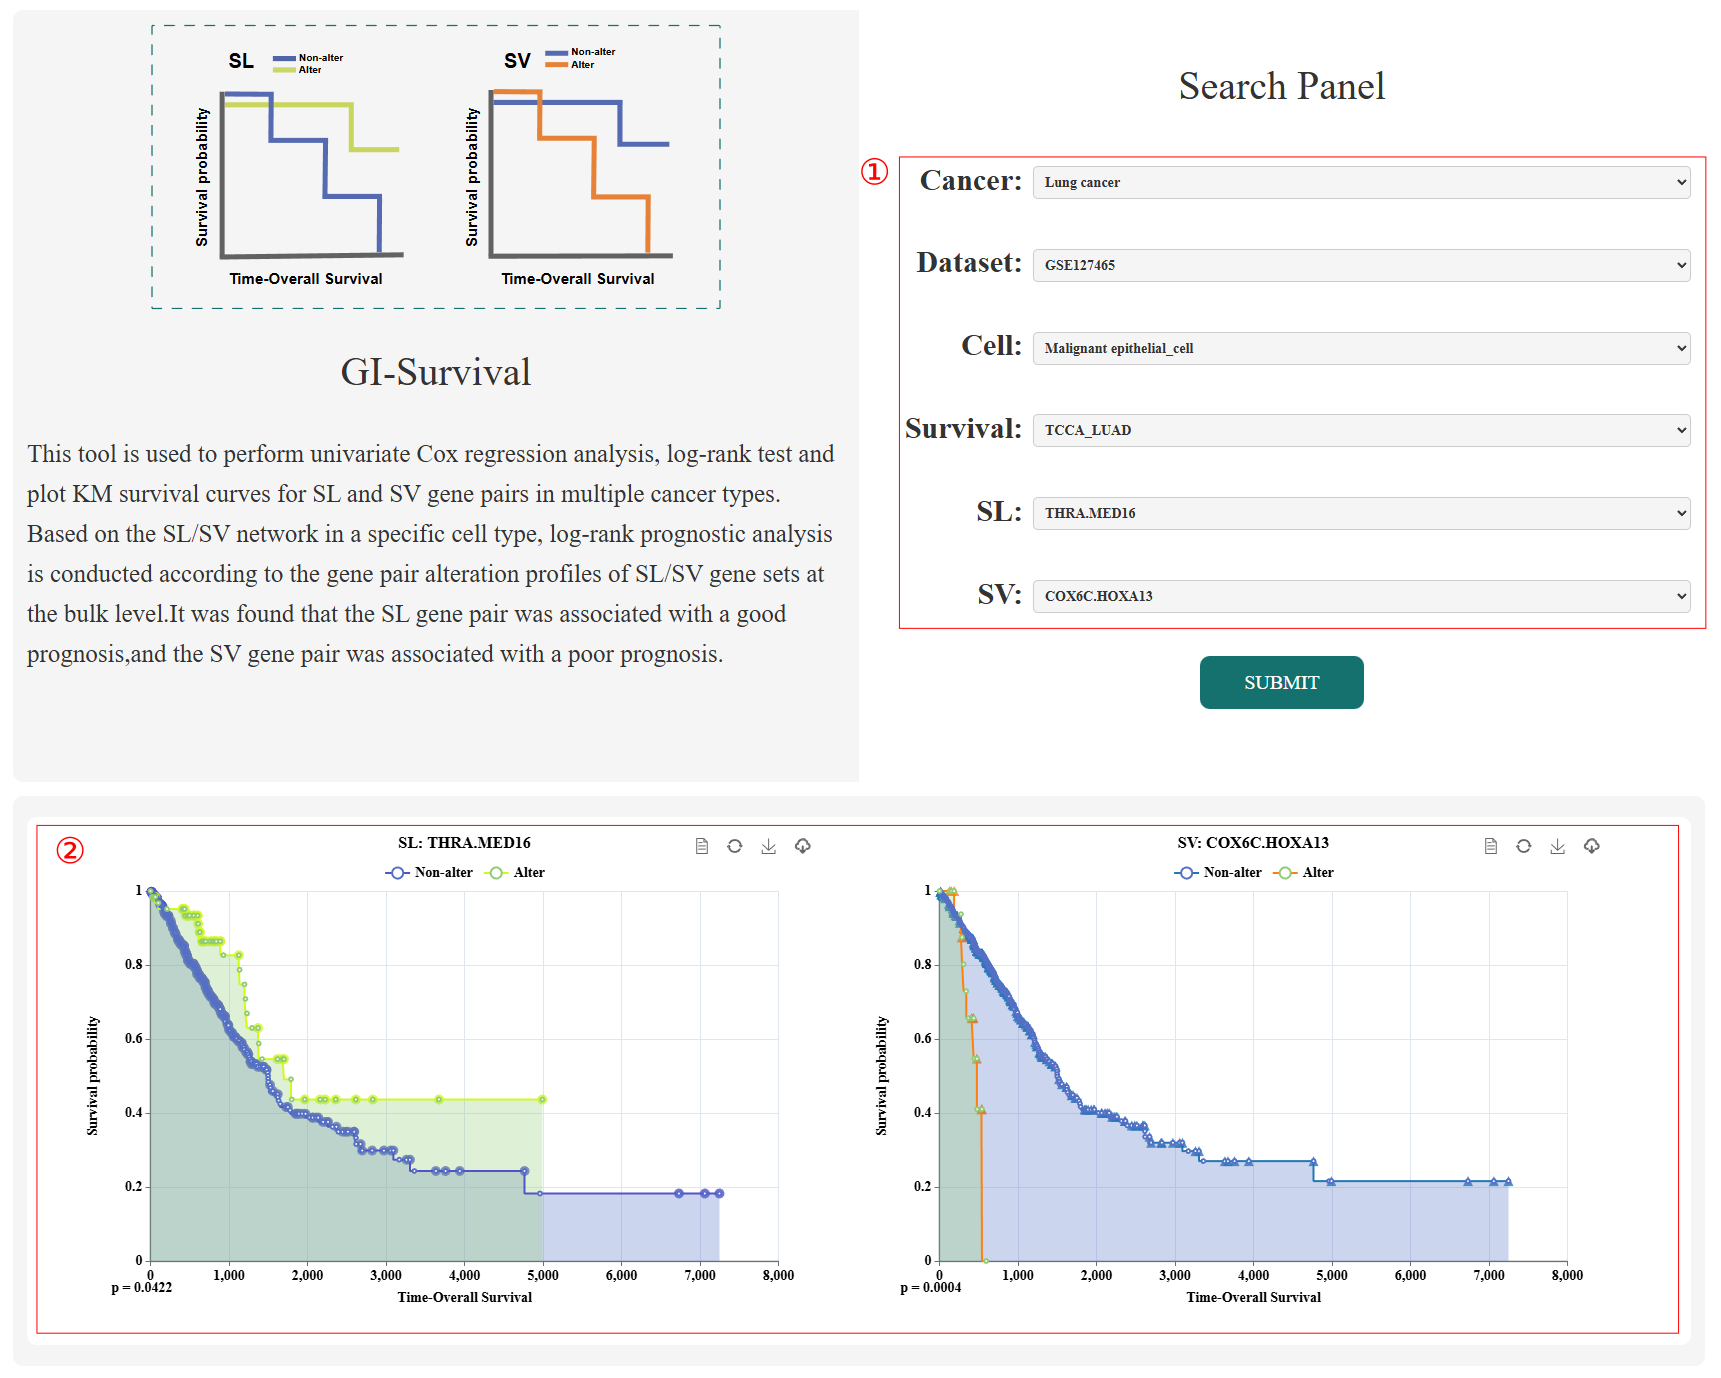
Figure 7
Tools:GI-Drug
1.Select the cancer type, dataset, cell type, and drug for your search.
2.UMAP visualization of drug efficacy score (DDS) for specific drugs in single-cell data.
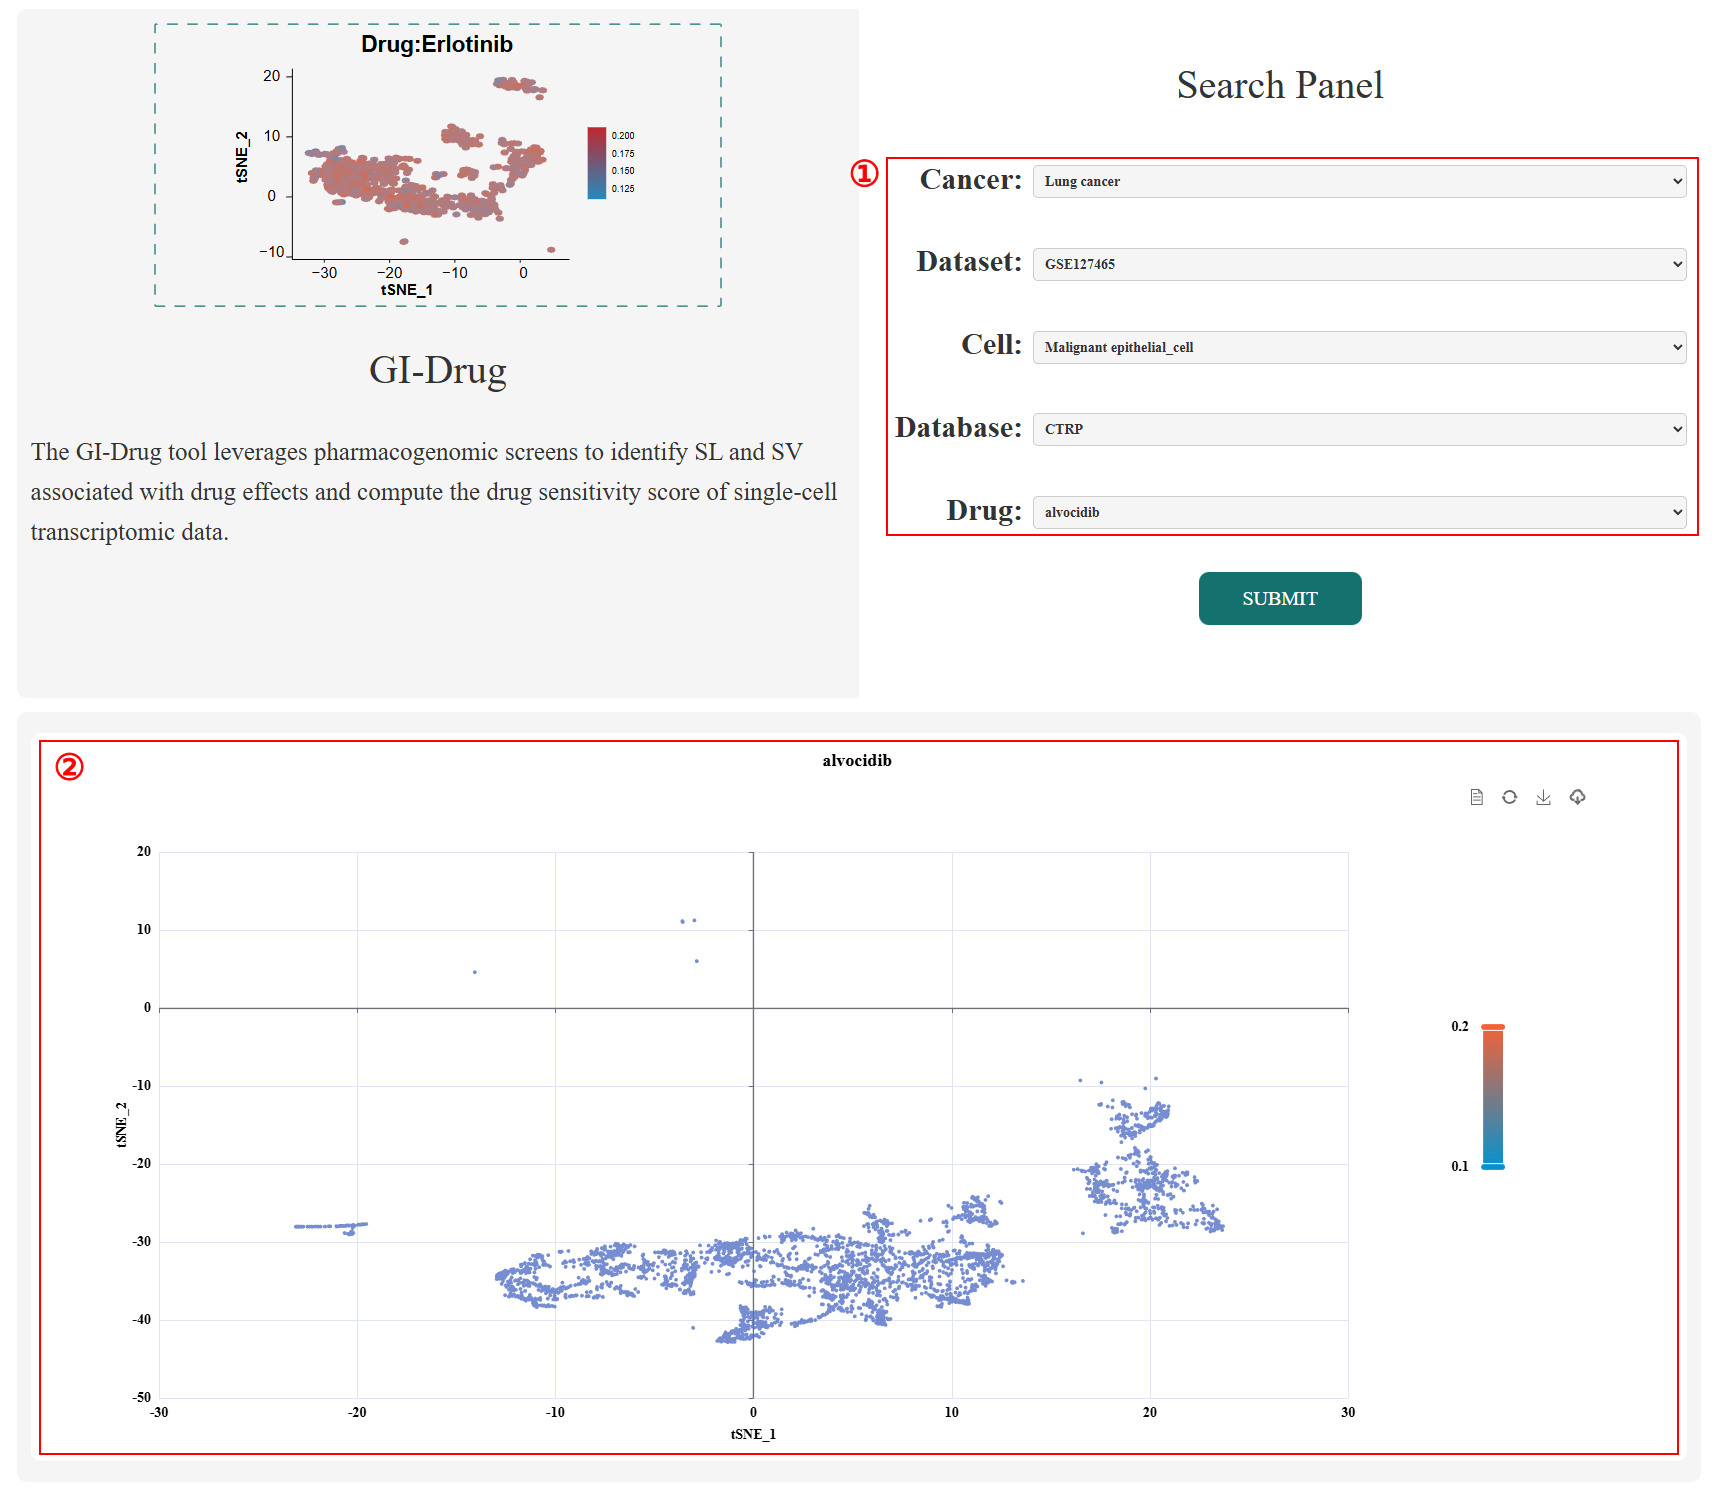
Figure 8
Tools:GI-Immunotherapy
1.Select the cancer type, dataset of gene pairs, cell type, dataset of immunotherapy, SL and SV gene pair for your search.
2.Stacked percentage bar chart shows the proportional differences in immunotherapy efficacy between patient groups with altered versus unaltered SL and SV gene pairs.
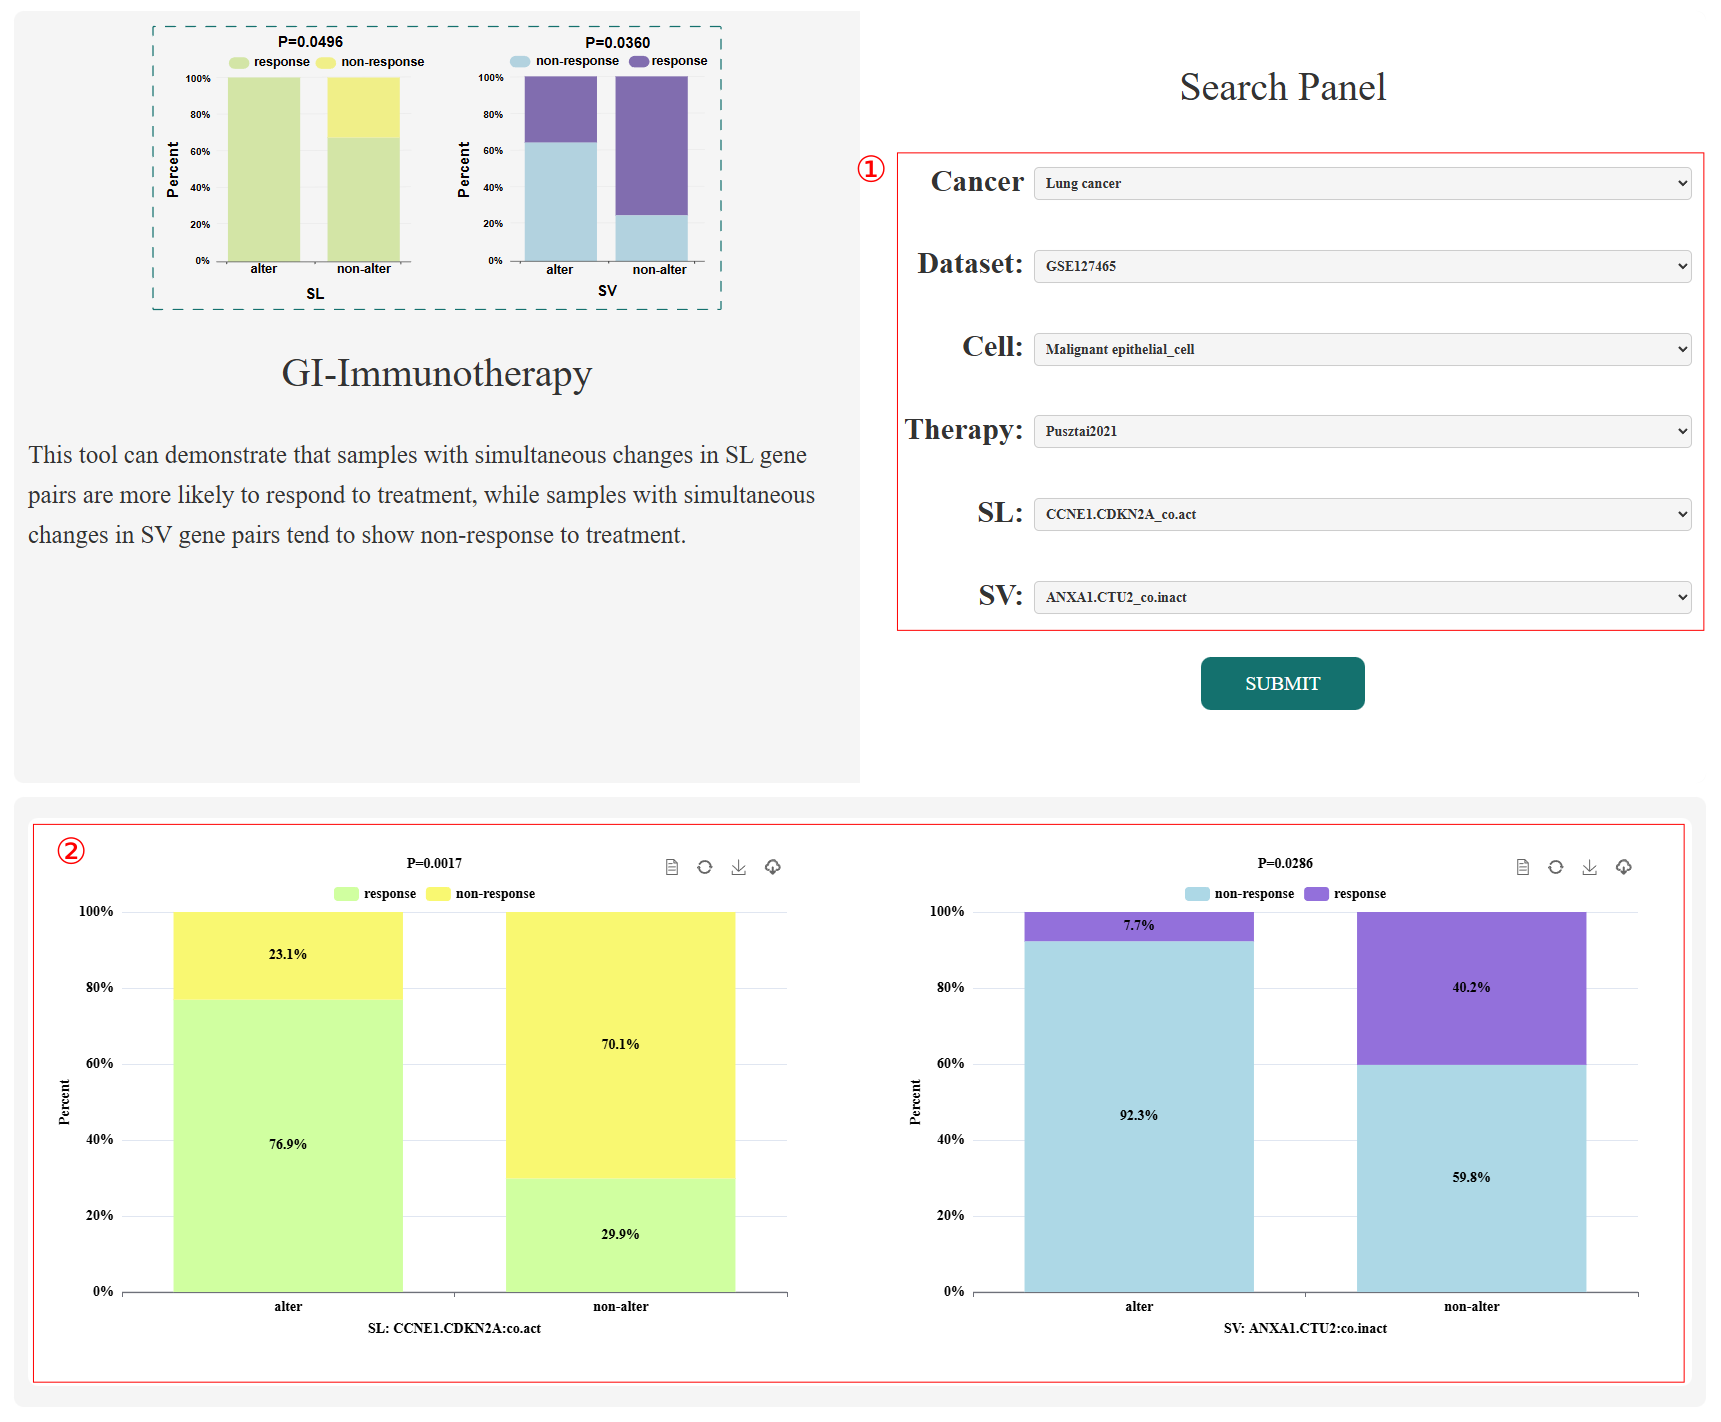
Figure 9
CellGIdb’s Statistics
1.The number of datasets, samples, cell types and cells in CellGIdb.
2.The cancer type and samples of CellGIdb.
3.The cell type and of CellGIdb.
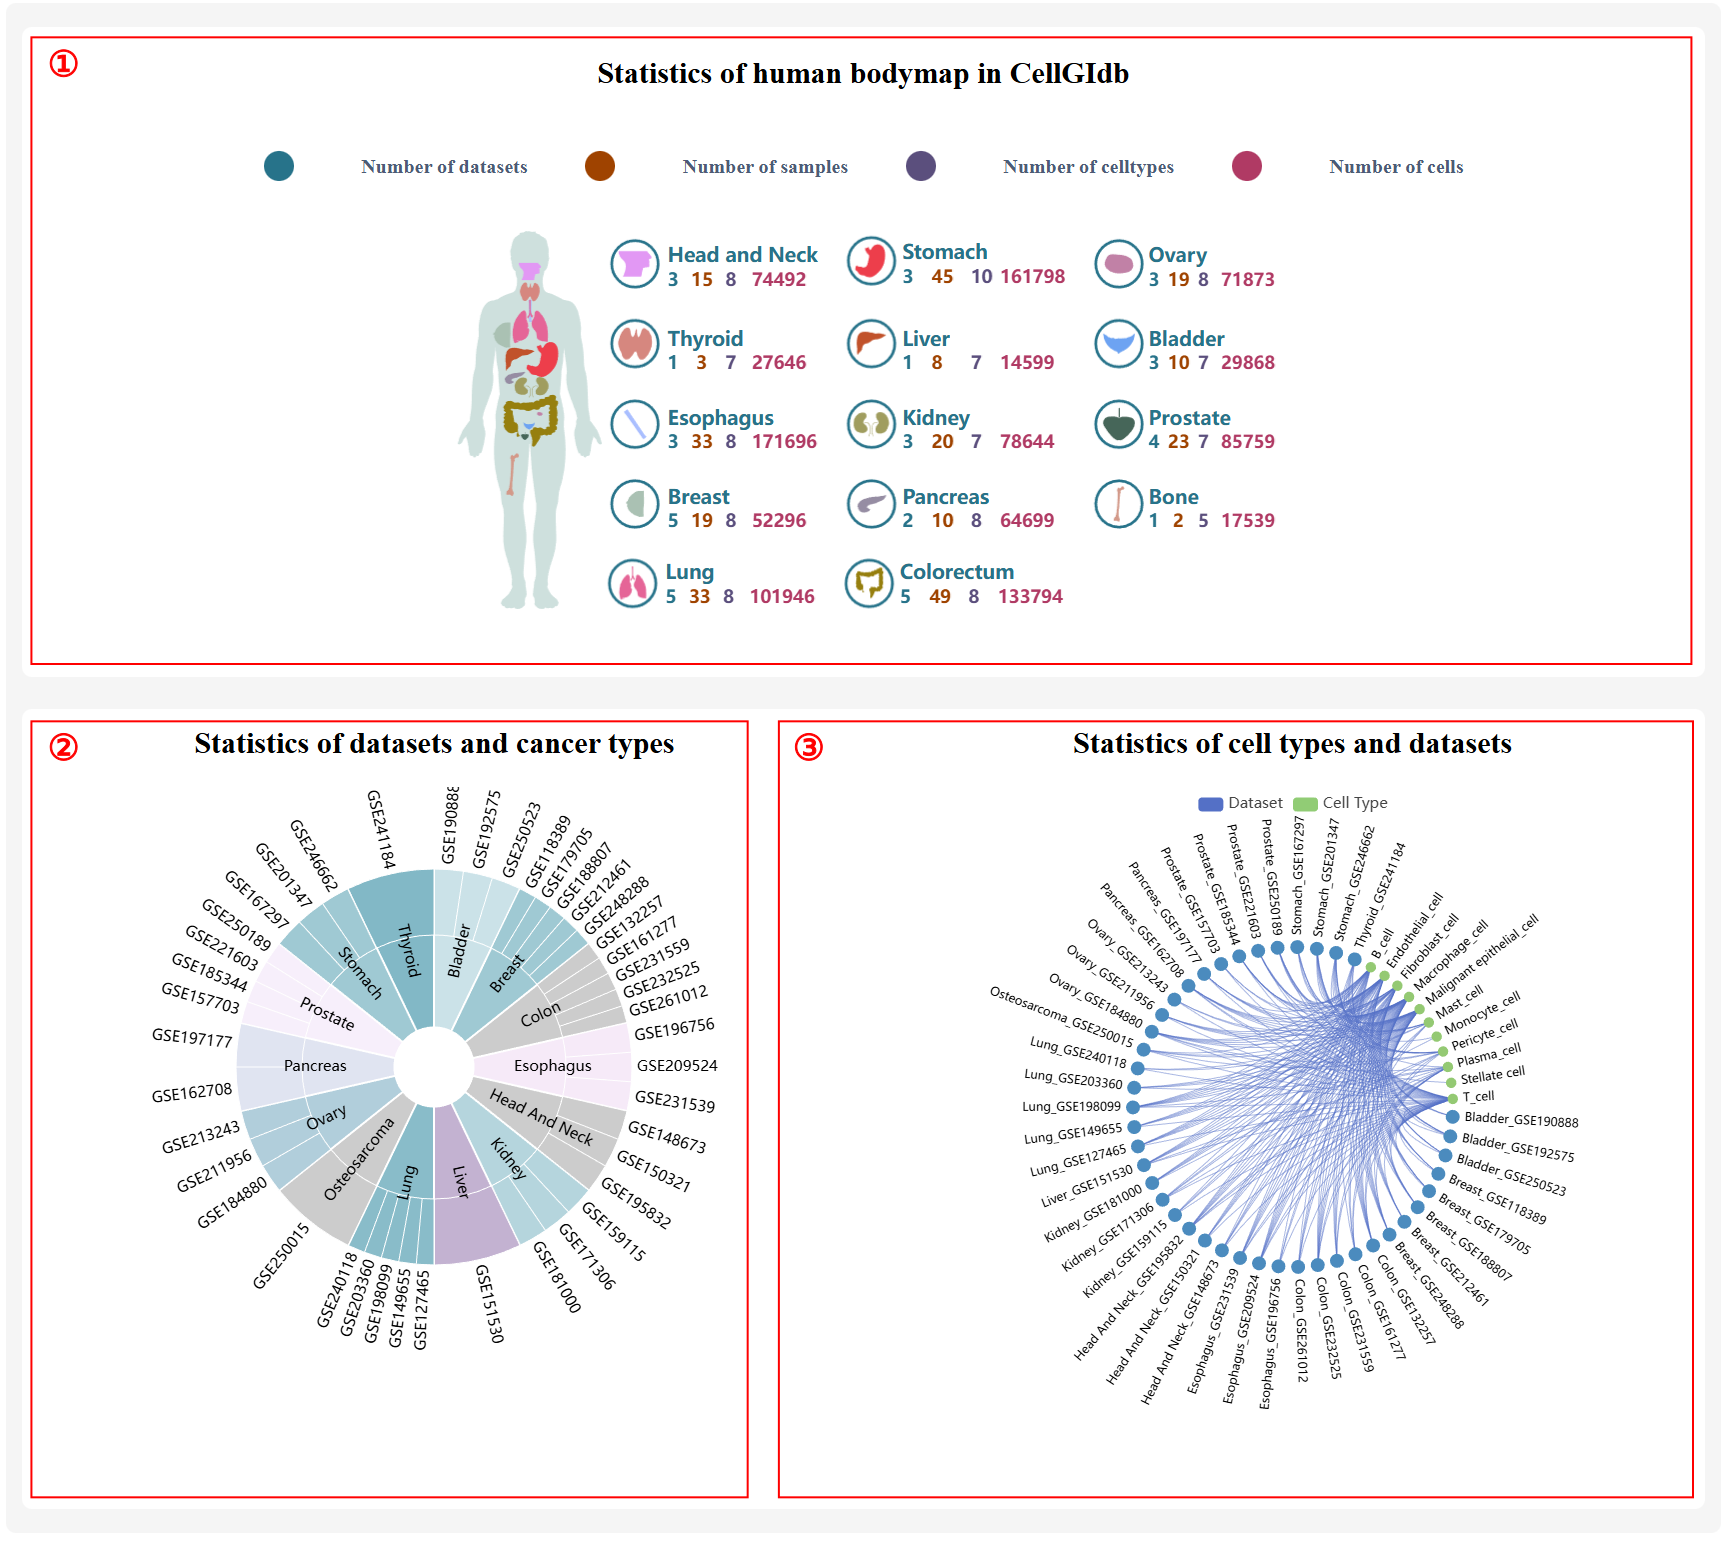
Figure 10
CellGIdb’s Download
On this page, Users can download the analysis results for all cell types from a specific dataset.
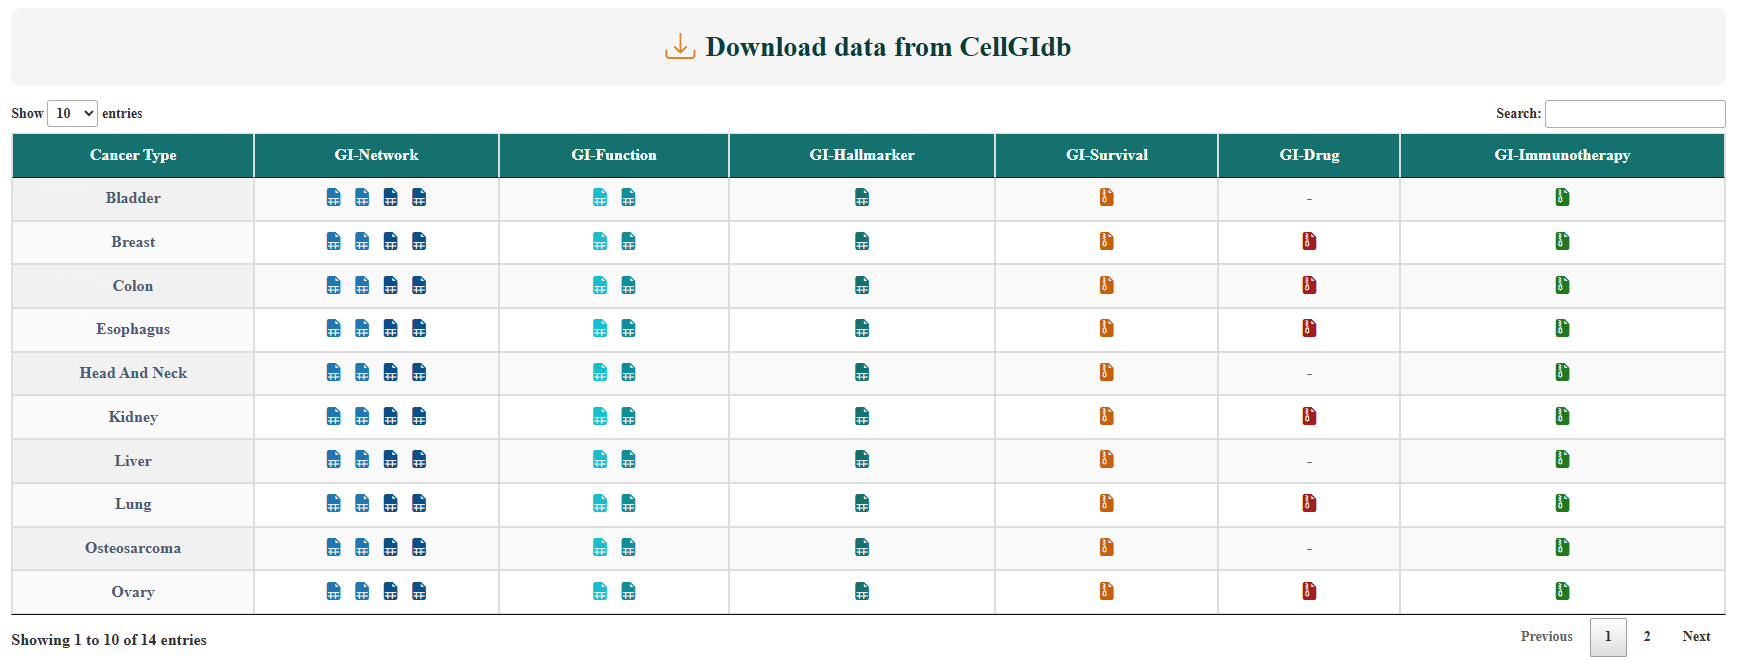
Figure 11